While I was on vacation, my remainder 20% position on EURUSD short daily chart was stopped out at 1.0725 with 1.90:1 as the final RR. This is my first weekly outlook report in 3 weeks therefore I am focusing more on the larger time frames to give a better picture of what has been happening in the last few weeks.
I have also added a summary of monthly and weekly trend as well as daily momentum for each pair that I write about. Since I am primarily a trend follower it would be easier for my readers to understand why I choose to go long or short. I look for scenarios that would make daily momentum aligns with the weekly trend before entering a trade.
AUDUSD
Monthly trend: DOWN
Weekly trend: DOWN
Daily momentum: NEUTRAL
This pair has been moving sideways for 2 months and has tested 0.7580 support twice in March. The daily chart offered a decent long reversal trade on Friday for those who can tolerate the risks of trading on NFP (now called Non Farm Employment Change). From my fundamental analysis, I am interested in shorts only. I'm looking for a daily close below 0.7530 as indication that support has been broken. Alternatively, if price rallies up to resistance at 0.7890 then I will be look for opportunities to short again.
EURAUD
Monthly trend: NEUTRAL
Weekly trend: DOWN
Daily momentum: UP
Price is testing dual resistance lines at 1.4410 on weekly chart. I will be looking for signs of strong selling on daily chart to go short.
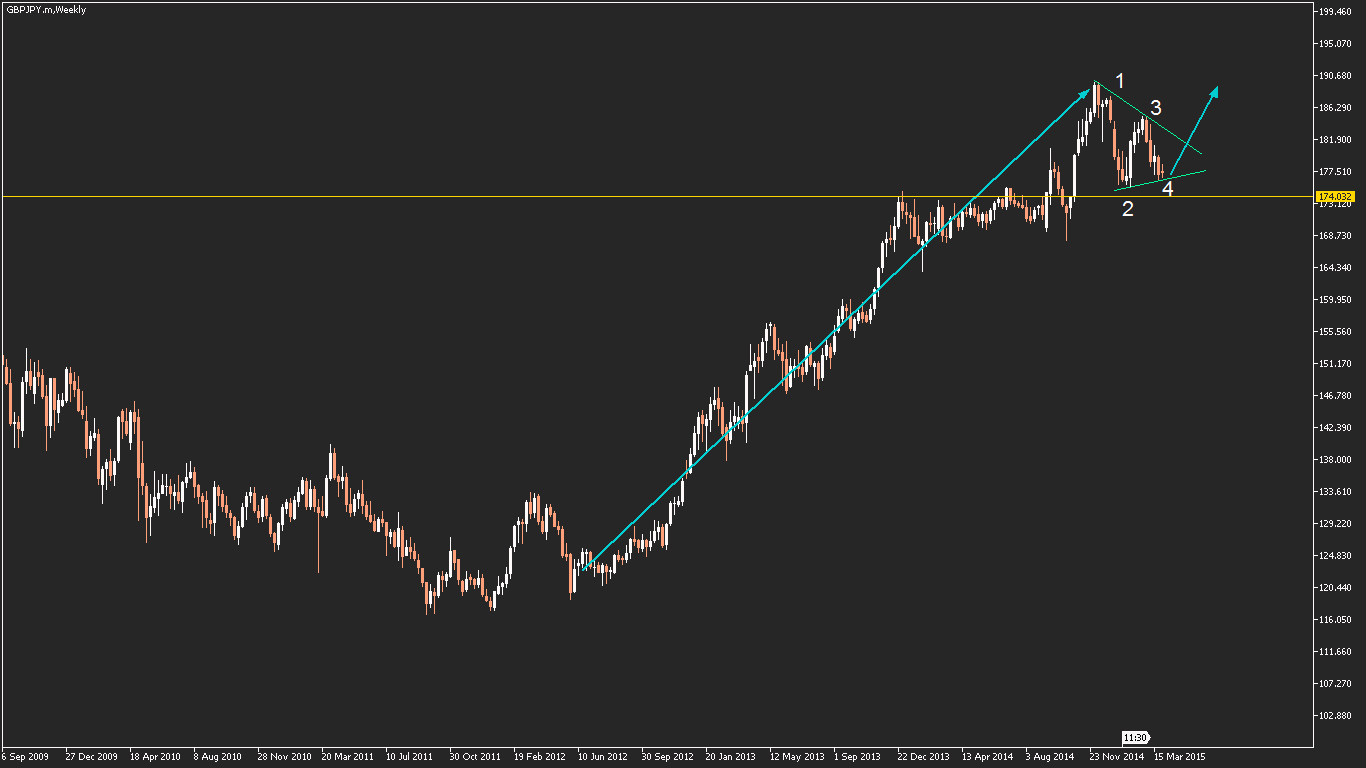
GBPJPY
Monthly trend: UP
Weekly trend: UP
Daily momentum: DOWN
On weekly chart, there is a symmetrical triangle pattern unfolding. This is one of a few patterns that I understand. This pattern suggests that another push up is the more likely scenario. I am looking for a weekly close above 183.00 as a sign that the pattern has completed.
GBPUSD
Monthly trend: DOWN
Weekly trend: DOWN
Daily momentum: NEUTRAL
USDCAD
Monthly trend: UP
Weekly trend: NEUTRAL
Daily momentum: NEUTRAL
On daily chart, this pair has been ranging between 1.2420 support and 1.2800 resistance. When market is ranging between support and resistance I will switch from trend following to price action reversal if the risk reward is there. I am looking for intraday reversal signals if this pair continues to range.
NZDUSD
Monthly trend: DOWN
Weekly trend: DOWN
Daily momentum: NEUTRAL
I am looking for opportunities to short on daily or smaller time frames if price tests 0.7650 resistance and there is strong signs of selling.
I have also added a summary of monthly and weekly trend as well as daily momentum for each pair that I write about. Since I am primarily a trend follower it would be easier for my readers to understand why I choose to go long or short. I look for scenarios that would make daily momentum aligns with the weekly trend before entering a trade.
AUDUSD
Monthly trend: DOWN
Weekly trend: DOWN
Daily momentum: NEUTRAL
This pair has been moving sideways for 2 months and has tested 0.7580 support twice in March. The daily chart offered a decent long reversal trade on Friday for those who can tolerate the risks of trading on NFP (now called Non Farm Employment Change). From my fundamental analysis, I am interested in shorts only. I'm looking for a daily close below 0.7530 as indication that support has been broken. Alternatively, if price rallies up to resistance at 0.7890 then I will be look for opportunities to short again.
EURAUD
Monthly trend: NEUTRAL
Weekly trend: DOWN
Daily momentum: UP
GBPJPY
Monthly trend: UP
Weekly trend: UP
Daily momentum: DOWN
GBPUSD
Monthly trend: DOWN
Weekly trend: DOWN
Daily momentum: NEUTRAL
Price action has been very messy for the last 3 weeks so I am staying out until I can see that the daily momentum is down.
USDCAD
Monthly trend: UP
Weekly trend: NEUTRAL
Daily momentum: NEUTRAL
NZDUSD
Monthly trend: DOWN
Weekly trend: DOWN
Daily momentum: NEUTRAL
I am looking for opportunities to short on daily or smaller time frames if price tests 0.7650 resistance and there is strong signs of selling.


No comments:
Post a Comment