Performance Tracking

AUDITED TRACK RECORD - VERIFIABLE ACCOUNT STATEMENTS - TRADING REAL MONEY


Friday 13 March 2015

Update

Hi everyone,

I am taking 2 weeks off in Canada. I will return on April 1st and resume my posts in that week. I have closed out all trades (except EURUSD) today because I am not trading whilst travelling. Here are updates to trades that I have entered or exited since Monday 9th March.

AUDUSD

Price retraced to 0.7740 resistance as I had wanted and I switched down to 1 hour chart to observe price action closely. Resistance was tested twice and after seeing that the second attempt was weaker than the first I decided to short at 0.7710 with -30 pips stop placed just above resistance.

Entry @ 0.7710
Stop @ 0.7740 (-30 pips)
TP1 @ 0.7650 (+60 pips) exited 80% for 2:1 RR
TP2 @ 0.7590 (+120 pips) exited 20% for 4:1 RR

Final RR for the trade is 2.4:1


AUDNZD

The down move came earlier than I had anticipated and I was not able to catch it on any intraday time frames.


EURUSD

I have moved my stop for the remainder 20% of my position to 1.0725 which is the high of the daily candle 11/3/2015. Swap is positive for this short so I don't see why I should close it now given the fact that it could continue to drop.
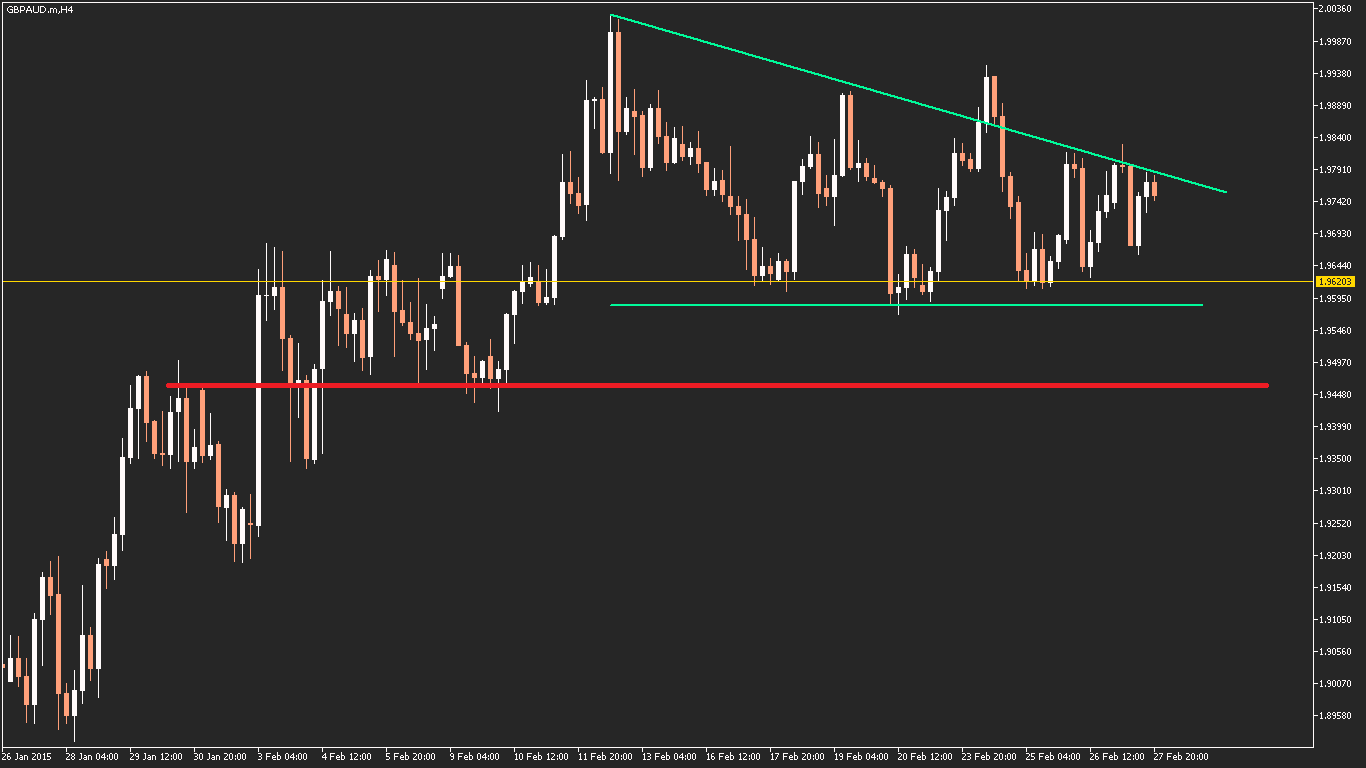


GBPAUD

This pair rallied hard and the remainder 20% of my short has been stopped out at break even.

Entry @ 1.9590
Stop @ 1.9630 (-40 pips) moved to break even
TP1 @ 1.9470 (+120 pips) exited 80% for RR of 3:1
TP2 @ 1.9350 (+240 pips)

Overall RR for this trade is 2.4:1 .


GBPJPY

Price has broken through both support lines therefore my prediction of a rally at support is no longer valid.


USDCAD

Last Sunday I mentioned that I was specifically looking for one of the two scenarios to take place before going long. It was scenario B that unfolded and I went long on 4 hour chart after price tested support on 12/3/2015 and price action showed me strong evidence of buying. I entered on the open of the following 4 hour candle.

Entry @ 1.2701
Stop @ 1.2614 (-87 pips)
TP1 @ 1.2795 (+94 pips)

I closed the trade today for +47 pips. Final RR is 0.54:1


Saturday 7 March 2015

Outlook for 9th - 13th March 2015

Technical Analysis

AUDUSD

Following better than forecasted NFP on Friday, this pair has broken below 0.7740 support which have been holding up for 5 weeks. I am now looking to see if price would retest this support-turned-resistance level as it could give opportunities to enter short. Next support level down is at 0.7650 which gives a potential +90 pips target. Therefore I am looking to have a stop of less than 50 pips to achieve good risk reward.


EURUSD

Last week I said that I am looking for a daily close below 1.1096 as a sign that the bearish move would continue. This happened on Thursday this week so I entered short on the open of Friday's daily candle. Stop was aggressively placed at the top of the Thursday candle. I say it was aggressive because volatility from NFP could have taken me out. Luckily that was not the case.

Entry @ 1.1024
Stop @ 1.1120 (-96 pips)
TP1 @ 1.0870 (+154 pips) exited 80% for RR of 1.6
Stop will now be trailed to hopefully continue riding the downtrend.


GBPAUD

This pair has broken below 1.9620 support as suggested in last week's outlook report. The retraced occurred on 5/3/2015 and I entered short on 1 hour chart after seeing strong signs of selling when price hit resistance.

Entry @ 1.9590
Stop @ 1.9630 (-40 pips) moved to breakeven
TP1 @ 1.9470 (+120 pips) exited 80% for RR of 3:1
TP2 @ 1.9350 (+240 pips)


I didn't have TP2 at the time of entry but now I have put it at the next support level on 4 hour chart at 1.9350 . This was almost hit when NFP came out.


GBPUSD

This pair has dropped 320 pips this week. It happened too fast for me to find a good entry to short. On the 4 hour chart, there was no retest of any support resistance level. Price is almost at the 1.5000 support level. If it managed to retrace 200 pips up towards the 1.5220 resistance then I would be looking on intraday time frames for short opportunities.


GBPJPY

On daily chart, this pair is testing dual support, horizontal support at 181.00 and the short term down trend (green line). Here I am looking for opportunities to go long in line with the weekly trend.


AUDNZD

This pair has been trending down on daily chart since November 2014. Right now price is looking to test resistance at 1.0530 which happens to be where resistance for the down trend would be. I am looking for opportunities to short. Ideally, I want to take it when the two resistance lines meet.


USDCAD

I've been following this pair for 6 weeks now waiting for confirmation of a breakout from the symmetrical triangles pattern. NFP did that on Friday. There are 2 scenarios that I am looking to enter long:

Scenario A - price retests the symmetrical triangles top line which should now be acting like support.


Scenario B - price breaks above horizontal resistance at 1.2640 and comes back to retest it.


Sunday 1 March 2015

Fundamental Analysis Feb 2015

This is the first in the series of fundamental analysis reports which I aim to publish within the first week of each month. I will focus on the four economy: Australia, Eurozone, UK and USA. You will find more emphasis on Australia because it is the economy that I am most familiar with. I will briefly go through the important economic data that has come out during the past month and make my analysis based on that.

At the end of the report I will state my views on the currency pairs.

Australia - Bearish

Interest rate was cut by 0.25% on Feb 3rd. Meeting minutes from the Reserve Bank of Australia suggests that another rate cut has already been planned for the year. The only question now is when that will happen. Unemployment was up 0.2% to 6.4% which is the highest it has been since 2001 and the top is still far away with car manufacturing to begin shutting down operations in 2016. Private capital expenditure, the money spent by private companies to expand their operations, have fallen sharply beyond forecast. Australia's top export commodity by revenue is iron ore and it is still in free fall (see graph below, courtesy of Macrobusiness). The loss of revenue due to the price drop is far greater than any gains produced by a lower AUD. Personally I don't see how cutting rates would help the situation. Australia must remove its dependency on iron ore to better manage its risks.


Eurozone - Bearish

Greece has dominated the headlines this month when negotiations for its debt repayment began. At the moment Greece spends much of its money repaying interest on debts and Greece wants its debt either written off or refinanced at a lower rate. Of course this does not sit well with other EU members whose banks have been lending money to Greece. In the end, a 4 month extension has been granted. Month to month manufacturing has been down for Germany and France. The only positive figure for Eurozone in Feb was  the German preliminary CPI which came out above forecast.


United Kingdom - Neutral

Head of Bank of England Mark Carney said they are happy with inflation despite how low it is. He hinted that the next move in interest rate would be up not down. I feel that this is purely just talk because all nine members of the Monetary Policy Committee vote for no change. Just in January we saw 2 members voting for a hike but now they have changed their mind. There are good news for UK: 0.1% drop in unemployment and wages growth have been greater than inflation. The biggest concern for UK that I can see is from its largest trading partner the Eurozone.


USA - Bullish

USA economy had a great run in 2014 and market is watching the Feb closely for a rate hike. In the last statement, the wording suggests that the Fed will raise rate when they are satisfied that economic growth has met their expectation. Since then, Preliminary GDP quarter-to-quarter and core CPI month-to-month has come out better than forecast. Next week's Non-Farm Payroll will be the figure to watch out. If it is as forecast or better, it would make it 6 months in a row.


My views:

AUDUSD - Bearish
GBPAUD - Bullish
EURAUD - Neutral
EURUSD - Bearish
EURGBP - Slightly bearish
GBPUSD - Slightly bearish


Outlook for 2nd - 6th Mar 2015

Technical Analysis

AUDUSD

Over the last few weeks, I've been talking about a pattern of a double bottom and higher high during the ranging phase before continuation of the down trend. This week price had put in that higher high and completed that pattern. Therefore I will be looking for opportunities to short.


On 4 hour chart, I am looking for a break below the uptrend channel as indication that market is about to move lower. It's too early to call entry, stop and target at this stage.


GBPAUD

This pair has tested the 1.9620 support level multiple times this week. On the 4 hour chart, there is a possible descending triangle pattern forming which suggests that a break below support is the more likely outcome if this pattern continues. However, on the daily chart momentum is still up so going short here is an aggressive trade. The next support level below 1.9620 is 1.9460 on 4 hour chart which gives a possible target of +160 pips. If there is an opportunity to short, I would have  to keep my stop below -50 pips to make the risk reward ratio worthwhile because this is trading against the daily trend.


GBPUSD

I missed a great short trade on this pair on 4 hour this week. It was testing dual resistance lines: daily resistance around 1.5550 and the upper line of the uptrend channel. This was a high probability trade with excellent RR. Now I wait patiently for price to retest resistance while keeping in mind that the lower line of the uptrend channel could act as resistance. Best scenario that I can see is when this trend support line meets horizontal resistance and price can break both in the same move.


USDCAD

The symmetrical triangle pattern is still unfolding for this pair. There was a false break out on the smaller time frames but on daily chart (where this pattern is taking place) price did not close above the top line of the pattern. It is said that the longer the pattern goes for, the stronger the break out would be. I am looking for a daily close above the top line because going long.


EURUSD

Finally this pair has decided to move again after 2 weeks of sideways movements. I am looking for a daily close below 1.1096 as a sign that the bearish move would continue.