Technical Analysis
AUDUSD
Over the last few weeks, I've been talking about a pattern of a double bottom and higher high during the ranging phase before continuation of the down trend. This week price had put in that higher high and completed that pattern. Therefore I will be looking for opportunities to short.

On 4 hour chart, I am looking for a break below the uptrend channel as indication that market is about to move lower. It's too early to call entry, stop and target at this stage.

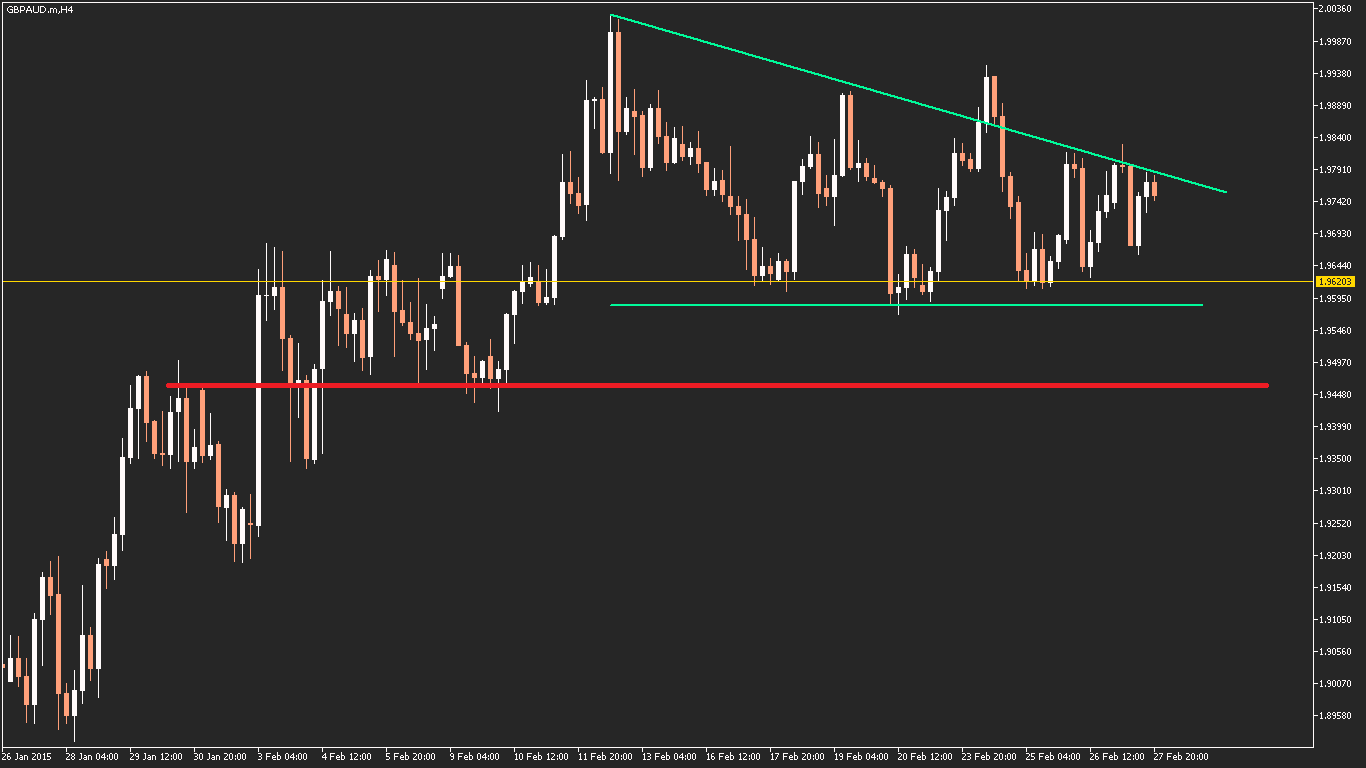
GBPAUD
This pair has tested the 1.9620 support level multiple times this week. On the 4 hour chart, there is a possible descending triangle pattern forming which suggests that a break below support is the more likely outcome if this pattern continues. However, on the daily chart momentum is still up so going short here is an aggressive trade. The next support level below 1.9620 is 1.9460 on 4 hour chart which gives a possible target of +160 pips. If there is an opportunity to short, I would have to keep my stop below -50 pips to make the risk reward ratio worthwhile because this is trading against the daily trend.
GBPUSD
I missed a great short trade on this pair on 4 hour this week. It was testing dual resistance lines: daily resistance around 1.5550 and the upper line of the uptrend channel. This was a high probability trade with excellent RR. Now I wait patiently for price to retest resistance while keeping in mind that the lower line of the uptrend channel could act as resistance. Best scenario that I can see is when this trend support line meets horizontal resistance and price can break both in the same move.

USDCAD
The symmetrical triangle pattern is still unfolding for this pair. There was a false break out on the smaller time frames but on daily chart (where this pattern is taking place) price did not close above the top line of the pattern. It is said that the longer the pattern goes for, the stronger the break out would be. I am looking for a daily close above the top line because going long.

EURUSD
Finally this pair has decided to move again after 2 weeks of sideways movements. I am looking for a daily close below 1.1096 as a sign that the bearish move would continue.

On 4 hour chart, I am looking for a break below the uptrend channel as indication that market is about to move lower. It's too early to call entry, stop and target at this stage.
GBPAUD
This pair has tested the 1.9620 support level multiple times this week. On the 4 hour chart, there is a possible descending triangle pattern forming which suggests that a break below support is the more likely outcome if this pattern continues. However, on the daily chart momentum is still up so going short here is an aggressive trade. The next support level below 1.9620 is 1.9460 on 4 hour chart which gives a possible target of +160 pips. If there is an opportunity to short, I would have to keep my stop below -50 pips to make the risk reward ratio worthwhile because this is trading against the daily trend.
GBPUSD
I missed a great short trade on this pair on 4 hour this week. It was testing dual resistance lines: daily resistance around 1.5550 and the upper line of the uptrend channel. This was a high probability trade with excellent RR. Now I wait patiently for price to retest resistance while keeping in mind that the lower line of the uptrend channel could act as resistance. Best scenario that I can see is when this trend support line meets horizontal resistance and price can break both in the same move.
USDCAD
The symmetrical triangle pattern is still unfolding for this pair. There was a false break out on the smaller time frames but on daily chart (where this pattern is taking place) price did not close above the top line of the pattern. It is said that the longer the pattern goes for, the stronger the break out would be. I am looking for a daily close above the top line because going long.
EURUSD
Finally this pair has decided to move again after 2 weeks of sideways movements. I am looking for a daily close below 1.1096 as a sign that the bearish move would continue.
No comments:
Post a Comment